
Map4 publishes a public nationwide ranking of the 100 USAC service provider IDs with the largest combined FY2026 E-Rate and Rural Health Care (RHC) committed funding. As of November 16, 2026, those 100 IDs account for $2.021 billion in combined commitments—$1.525 billion in E-Rate and $495.78 million in RHC—or 67.7% of nationwide commitments in the same window.
The live table is at Map4’s USAC Top 100 Service Providers. The board is rebuilt from public USAC data on a daily cycle, so the figures in this post are a snapshot, not a live feed. The November 16 page was generated at 3:27:52 p.m. Eastern.
View the Daily USAC Leaderboard
How the ranking works
Providers are ranked by combined FY2026 committed funding, not by payments. Each USAC provider ID is ranked on its own. Name variants inside one ID are combined; the page does not merge parent companies or roll multiple IDs together. The same company can therefore appear more than once. These are not whole-company market-share figures.
FY2026 and FY2025 are compared through November 16 of each year, using commitment-letter dates. Funding years begin July 1. The amounts are current source values, not reconstructed historical balances, so later reductions or corrections are not rewound. That matches Map4’s Daily Awards convention.
For E-Rate, the page uses current form versions and Funded FRNs only and sums the funding commitment request after the decision, excluding original Pending versions and nonfunded requests. For RHC, it includes Committed, Processed or Approved statuses and sums the committed amount at the FRN-line level. No geographic, service-category or technology filter is applied, so equipment and systems providers appear alongside carriers. Identity joins use E-Rate organization IDs and RHC service provider IDs (SPIN/498 IDs).
Authorized disbursements are shown separately. They are cumulative amounts currently reported against the included FY2026 records, not cash paid in a dated window, and they are never added to commitments or used for ranking. Year-over-year percentages use unrounded source amounts for the same ID. Table dollar columns are rounded to whole thousands.
Records without a commitment date are excluded (E-Rate FY2026 $1,424,291.54 and FY2025 $12,033,386.09; RHC FY2026 $0.00 and FY2025 $1,398,692.00). Lifeline and High Cost are outside this ranking. The page reports that 34 source checks passed, including nationwide reconciliation and 800 independent selected-ID comparisons. This is an independent Map4 analysis of public USAC data, not an official USAC publication.
What the November 16 table shows
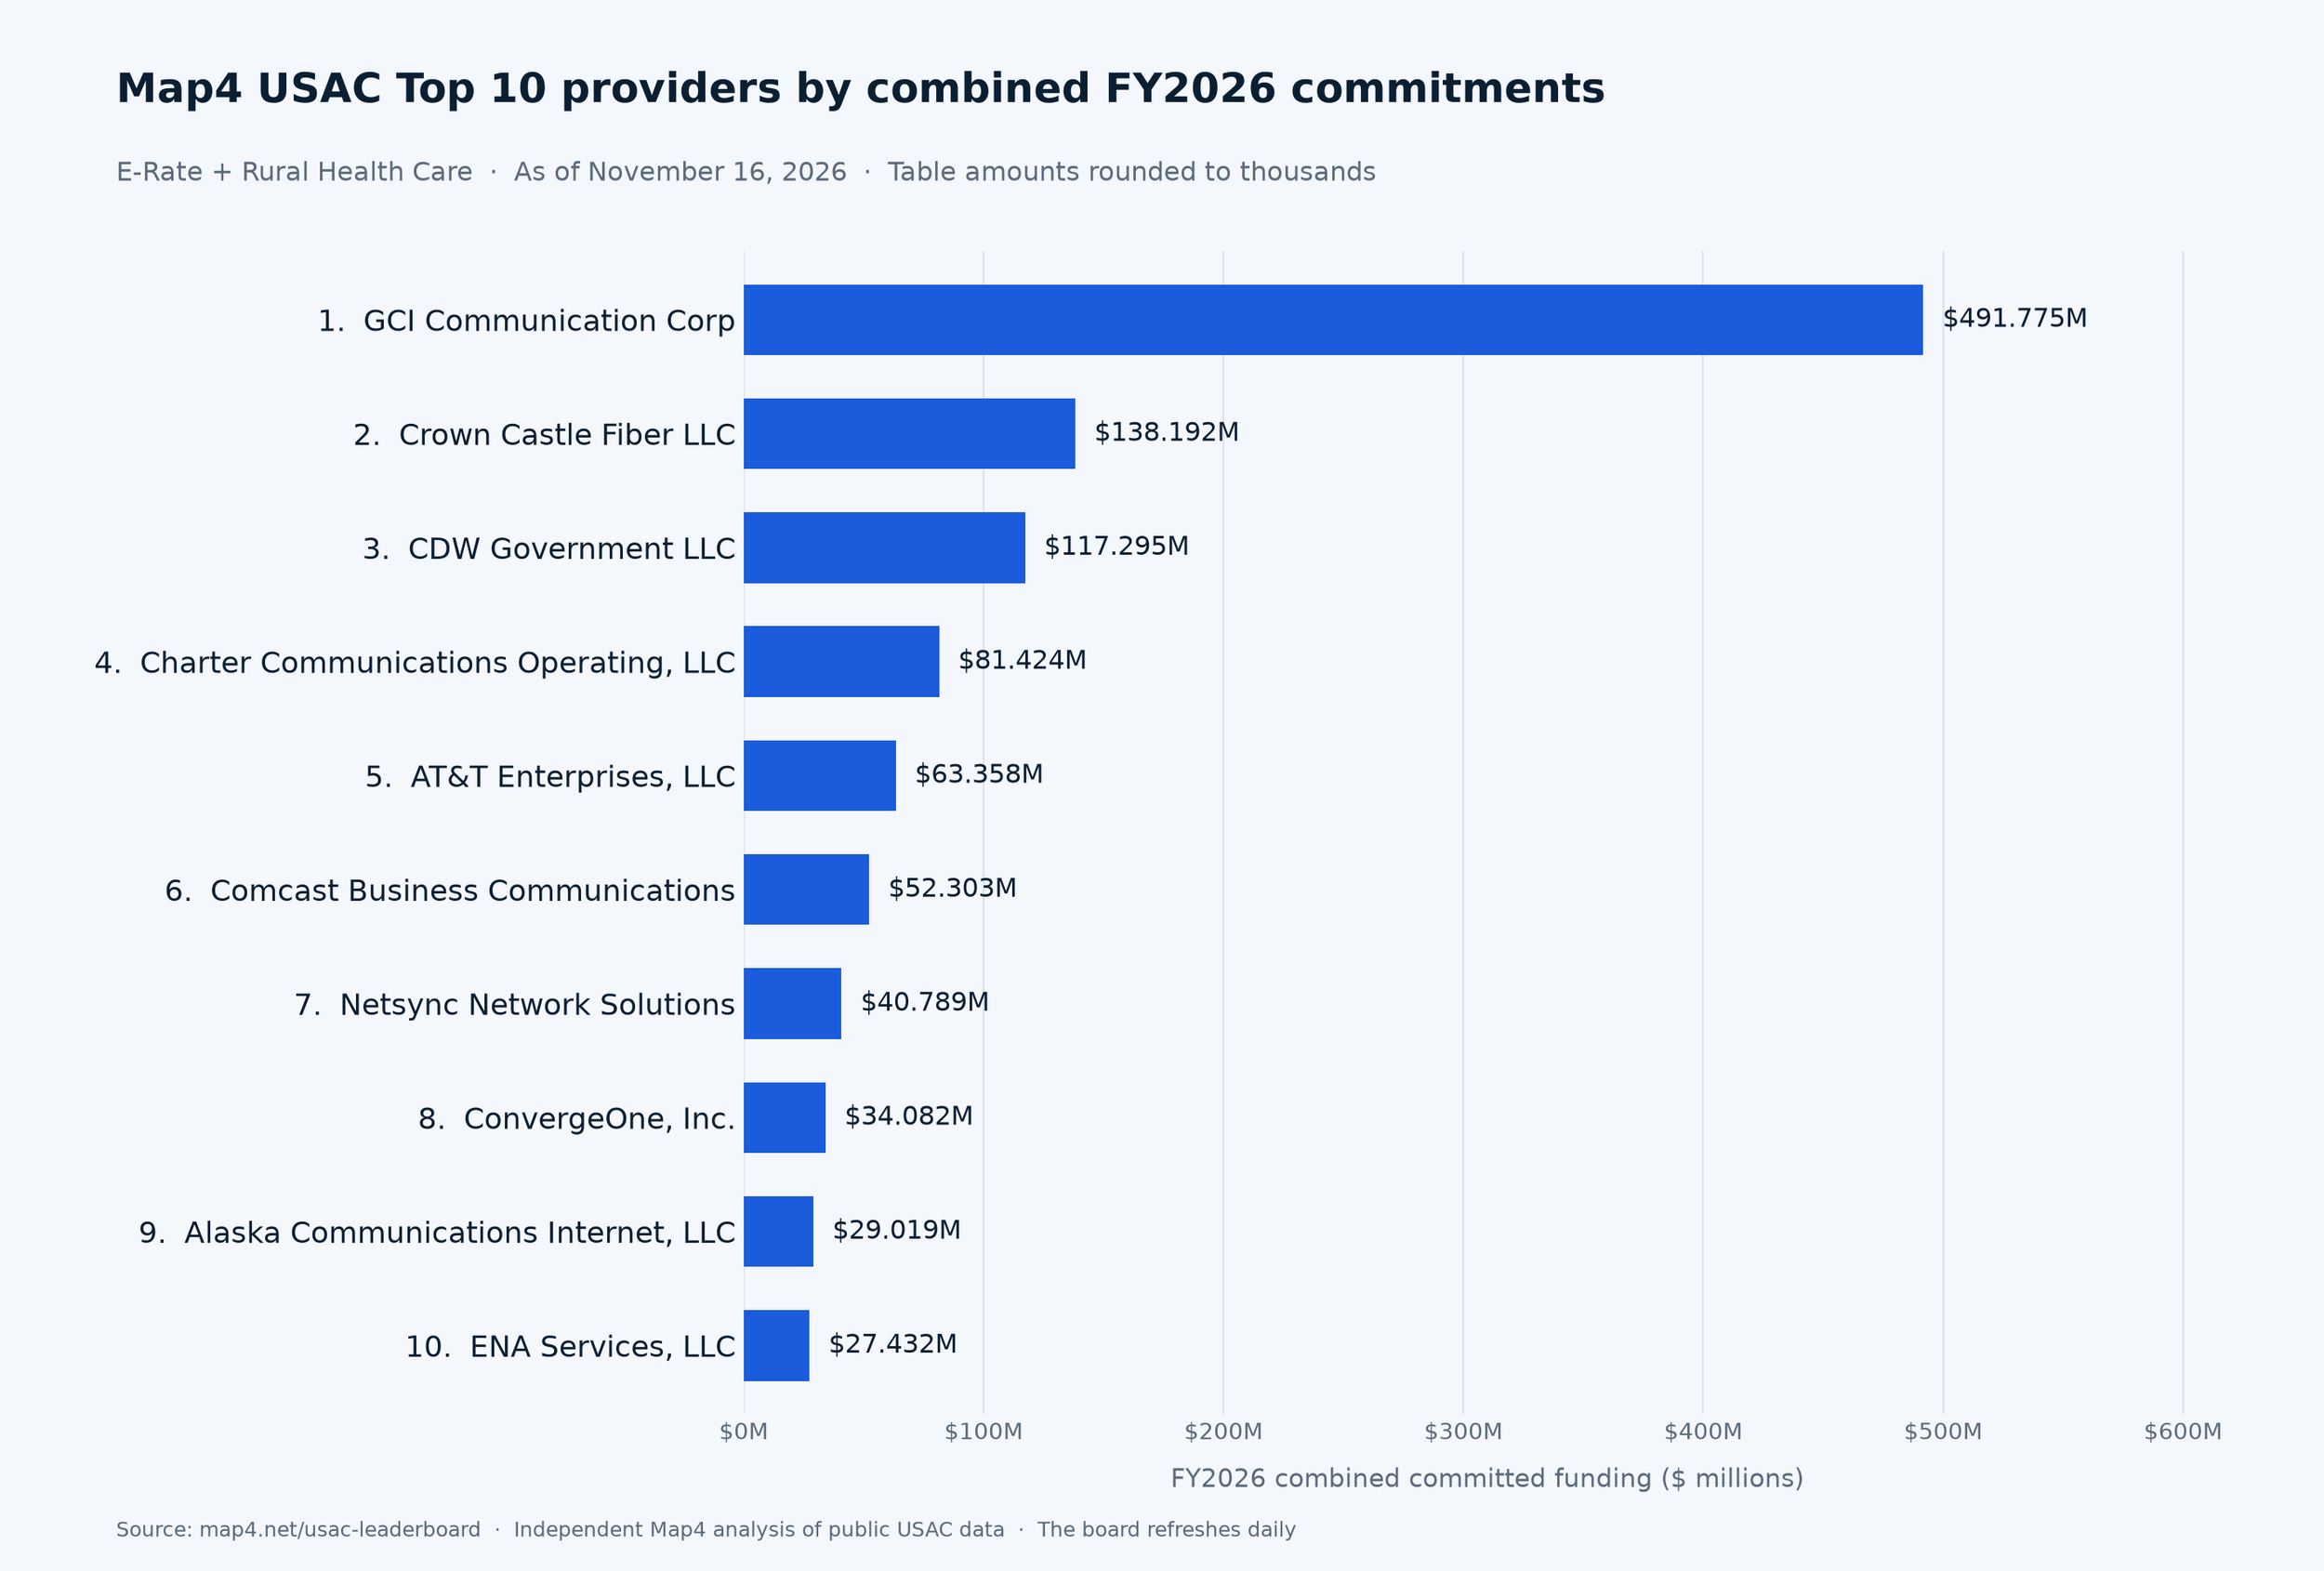
Using the page’s rounded thousands, the current top 10 are: GCI Communication Corp, $491.775 million (up 26.5% from $388.896 million a year earlier); Crown Castle Fiber LLC, $138.192 million (up 1.2%); CDW Government LLC, $117.295 million (up 7.2%); Charter Communications Operating, LLC, $81.424 million (down 1.1%); AT&T Enterprises, LLC, $63.358 million (down 6.1%); Comcast Business Communications, $52.303 million (down 7.0%); Netsync Network Solutions, $40.789 million (up 25.8%); ConvergeOne, Inc., $34.082 million (up 239.5%); Alaska Communications Internet, LLC, $29.019 million (up 132.7%); and ENA Services, LLC, $27.432 million (down 71.5% from $96.396 million a year earlier).
These 10 IDs add up to $1.076 billion, just over half of the Top 100’s $2.021 billion. GCI’s lead is largely an RHC result: $322.895 million of its total is Rural Health Care, with $168.880 million in E-Rate. Crown Castle and CDW are E-Rate-heavy ($130.854 million of Crown Castle’s total and $116.768 million of CDW’s). Alaska Communications is mostly RHC ($27.171 million). Netsync, ConvergeOne and ENA show no RHC in this table.
United Data Technologies, Inc. appears twice, at rank 12 (ID 143054389, $25.428 million) and rank 48 (ID 143020605, $8.906 million), because each ID is scored separately. Some year-over-year percentages are very large in both directions—Zayo Group, LLC (rank 45) is down 70.7%, close to ENA’s 71.5% decline, and ConvergeOne’s 239.5% increase is one of several sharp gains. Because the comparison uses current source values and does not rewind later corrections, and because ID transfers and multi-year commitments can move amounts, a large percentage change is a prompt to inspect the ID, not proof of a single-year sales result.
Authorized disbursements lag commitments, as the page warns they can. GCI shows $66.410 million in authorized disbursements against $491.775 million committed. Crown Castle shows $97,000 against $138.192 million committed.
Who the report is for
If you sell fiber, broadband or related services to schools, libraries or rural health care providers, the ranking places a USAC provider ID in nationwide context. It will not tell you which states or buildings those commitments sit in. The page applies no geographic filter, and this post does not infer one.
For location work, use the ranking with Map4’s opportunity tools:
- Open the USAC Top 100 leaderboard and find the provider ID, the E-Rate and RHC split, and the year-over-year comparison.
- Check nearby applicants and routes on the Map4 National Map. The National Fiber Map for Telecom RFPs + Map4 Relay Launch post describes the map layer in more detail.
- See how daily E-Rate, Rural Health Care and state RFP email alerts screen new filings against your fiber.
- For a state-level pricing example, see Illinois DIA Pricing: E-Rate Median MRC by Speed Group.
The leaderboard will change as USAC posts new commitments and as source records are corrected. Check the “as of” date on the page when you use the numbers.
Source: Independent Map4 analysis of public USAC data, as of November 16, 2026 (page generated 3:27:52 p.m. ET). Not an official USAC publication.
Questions: support@map4.net · Chris Nunez, chris.nunez@map4.net
